WEEK 1 | Session Notes
Graphic Information Design
= used to explain complex ideas efficiently in a clear way, it's the graphical representation of facts, figures and information
In architecture
-early black and white engravings 1500' to 1600'
-early 'cutaway' drawings = principle still being used today
In Books
-Oliver Byrne's redrawing of the mathematical Euclid ('Elements of Euclid') in 1847
-uses colours instead of figures for more clarity
In Maps
-information is mostly designed in maps
-easy to understand
In everyday visual systems
-Harry Beck- redesigned the London Underground map in 1933
-previous models tried to show every turn, distance and landscape
-Beck knew that passenger only needed to know where to get off
Road Signage
-up to 1930' were quite confusing
-debate whether low-caps or capitals were better to use and read
-re-design by Jock Kinnier and Margaret Calvert
=> their design became a role-model
1950' Eagle Comic Cutaway Diagrams
-Comics have been educating children with complex cutaway diagrams of machinery or structures
Will Burtin's WW2 GI Instruction Manual
-was created when Burtin was asked to design a manual for young (and mostly uneducated men) U.S. army recruits
Otto Neurath - ISOTYPES
-Neurath was influenced by Egyptian hieroglyphs and bold flat colours = flat simplified shapes
-he developed International system for Typographic Picture Education during the late 1920's (=ISOTYPE)
US Fortune Magazines
-developed a reputation for its maps during the 30's
=maps helped clarify the political changes and trade landscape
Graphs and Pie Charts
-graphical representations of polls or statistics in magazines such as 'Fortune'
-modern represtations of figures have been brought back by designers such as Nigel Holmes
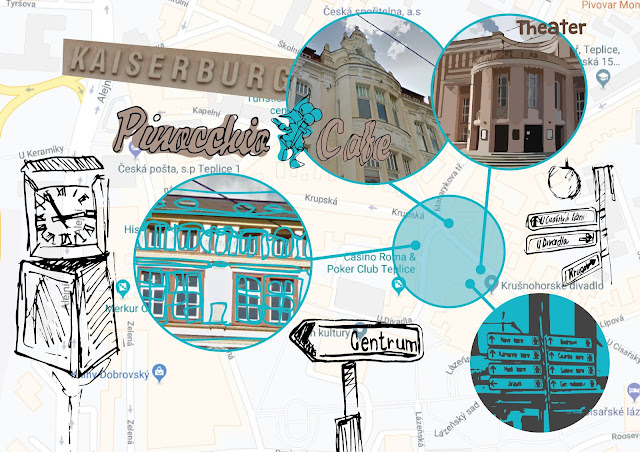
Signs & Wayfinding
-come in many sizes and way
-all around train stations, bus stops, airports, parks,...
In the Media
-TV graphics - weather forecast
-TV programmes
- General Election graphics
-Films
= used to explain complex ideas efficiently in a clear way, it's the graphical representation of facts, figures and information
In architecture
-early black and white engravings 1500' to 1600'
-early 'cutaway' drawings = principle still being used today
In Books
-Oliver Byrne's redrawing of the mathematical Euclid ('Elements of Euclid') in 1847
-uses colours instead of figures for more clarity
In Maps
-information is mostly designed in maps
-easy to understand
In everyday visual systems
-Harry Beck- redesigned the London Underground map in 1933
-previous models tried to show every turn, distance and landscape
-Beck knew that passenger only needed to know where to get off
Road Signage
-up to 1930' were quite confusing
-debate whether low-caps or capitals were better to use and read
-re-design by Jock Kinnier and Margaret Calvert
=> their design became a role-model
1950' Eagle Comic Cutaway Diagrams
-Comics have been educating children with complex cutaway diagrams of machinery or structures
Will Burtin's WW2 GI Instruction Manual
-was created when Burtin was asked to design a manual for young (and mostly uneducated men) U.S. army recruits
Otto Neurath - ISOTYPES
-Neurath was influenced by Egyptian hieroglyphs and bold flat colours = flat simplified shapes
-he developed International system for Typographic Picture Education during the late 1920's (=ISOTYPE)
US Fortune Magazines
-developed a reputation for its maps during the 30's
=maps helped clarify the political changes and trade landscape
Graphs and Pie Charts
-graphical representations of polls or statistics in magazines such as 'Fortune'
-modern represtations of figures have been brought back by designers such as Nigel Holmes
Signs & Wayfinding
-come in many sizes and way
-all around train stations, bus stops, airports, parks,...
In the Media
-TV graphics - weather forecast
-TV programmes
- General Election graphics
-Films
Comments
Post a Comment